


MATIC was at its all-time high on 27th December, at $2.92, after which it has constantly been falling, and the price is moving below the downtrend line. The MATIC price is currently taking the support of the uptrend line extending from September end.
On 24th February, the price got tested, and a swing low was formed, but the price couldn’t close below the trend line. If the price gets rejected, it can be an opportunity for the bulls as bullish candles were formed after that, with the price closing above the swing high of $1.51.
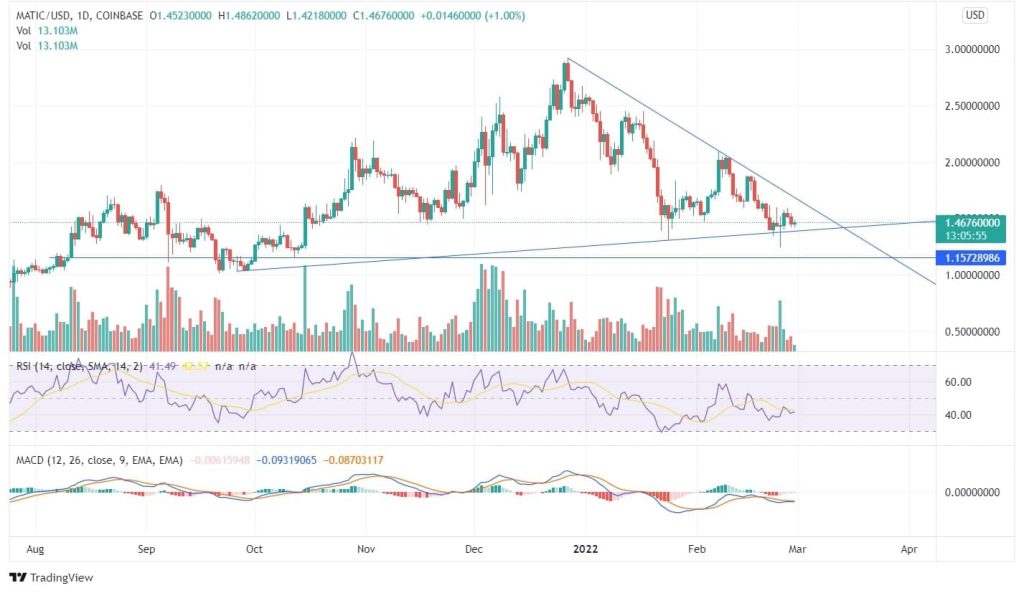
The MACD line is below the signal line currently with diminishing red candles on the daily chart. The MACD line and the signal line are about to intersect each other. A bullish momentum can be expected once the price closes above the swing high of $1.59 and the candle closes above the downtrend line.
On 24th February, there was an immense bull volume, but the bulls couldn’t close the price at the highs even though they pushed the price to $1.51, and the price closed around where it opened. The RSI indicator is at 41 is currently in the neutral zone.
On the weekly chart, the technical parameters are already in the bearish zone, and the coin had declined tremendously from when the indicators gave a sell signal. However, in the previous week’s bearish candle, the coin gave decent returns to its bears.
Will the bulls push the MATIC price? Click here to know more about MATIC price prediction. Once the coin suppresses the downtrend line, an up-trending pattern can be expected in the long run.
The price is currently trailing at a vital point from where a strong uptrend or downtrend may occur depending on the price closing above or below the swing high or swing low.
Though there is a formation of bullish divergence in the 4-hour chart, the price hasn’t yet closed above the peak of the divergence, which is $1.59. The investors can wait for candle formation and the price close before entering the trade.
However, if the coin continues to fall, it may reach its low of $1.15, and from there, a turnaround can be expected.